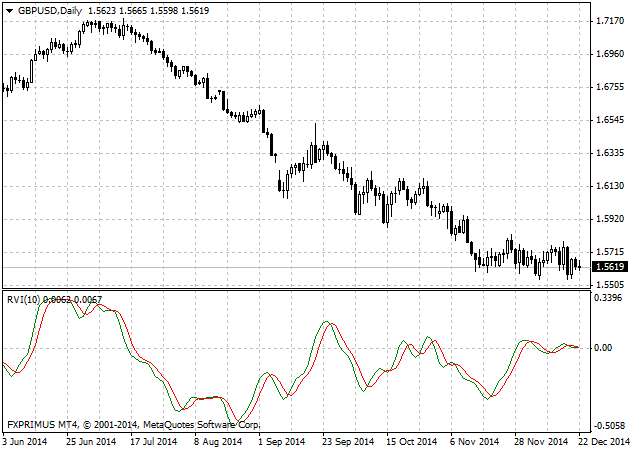
Relative Vigor Index Indicator Definition
Relative Vigor Index, developed by John Ehlers, is a technical indicator designed to determine price trend direction. The underlying logic is based on the assumption that close prices tend to be higher than open prices in a bullish environment and lower in a bearish environment.
How to Use Relative Vigor Index in Trading
The Relative Vigor Index allows to identify the reinforcement of price changes (and therefore may be used within convergence/divergence patterns analysis):
- Generally the higher the indicator climbs, the stronger is the current relative price increase;
- Generally the lower the indicator falls, the stronger is the current relative price drop.
Together with its signal line (Red), a 4-period moving average of RVI, the indicator (Green) may help to identify changes in prevailing price developments:
- Crossing the signal line from above, the RVI signals a possible sell opportunity;
- Crossing the signal line from below, the RVI signals a possible buy opportunity.
Relative Vigor Index Formula (RVI Calculation)
Relative Vigor Index (1) = (Close – Open) / (High – Low)
Relative Vigor Index (10) = 10-period SMA of Relative Vigor Index (1)
How to Install Relative Vigor Index in MT4 Charts
RVI indicator is standard Metatrader indicators, to put this indicator in your chart, please click Insert >> Indicators >> Oscillator >> Relative Vigor Index . The default setting momentum indicator is a period of 10.


